Reality, documentary and competition series round out list now that the World Cup is over.
by
July 22, 2026
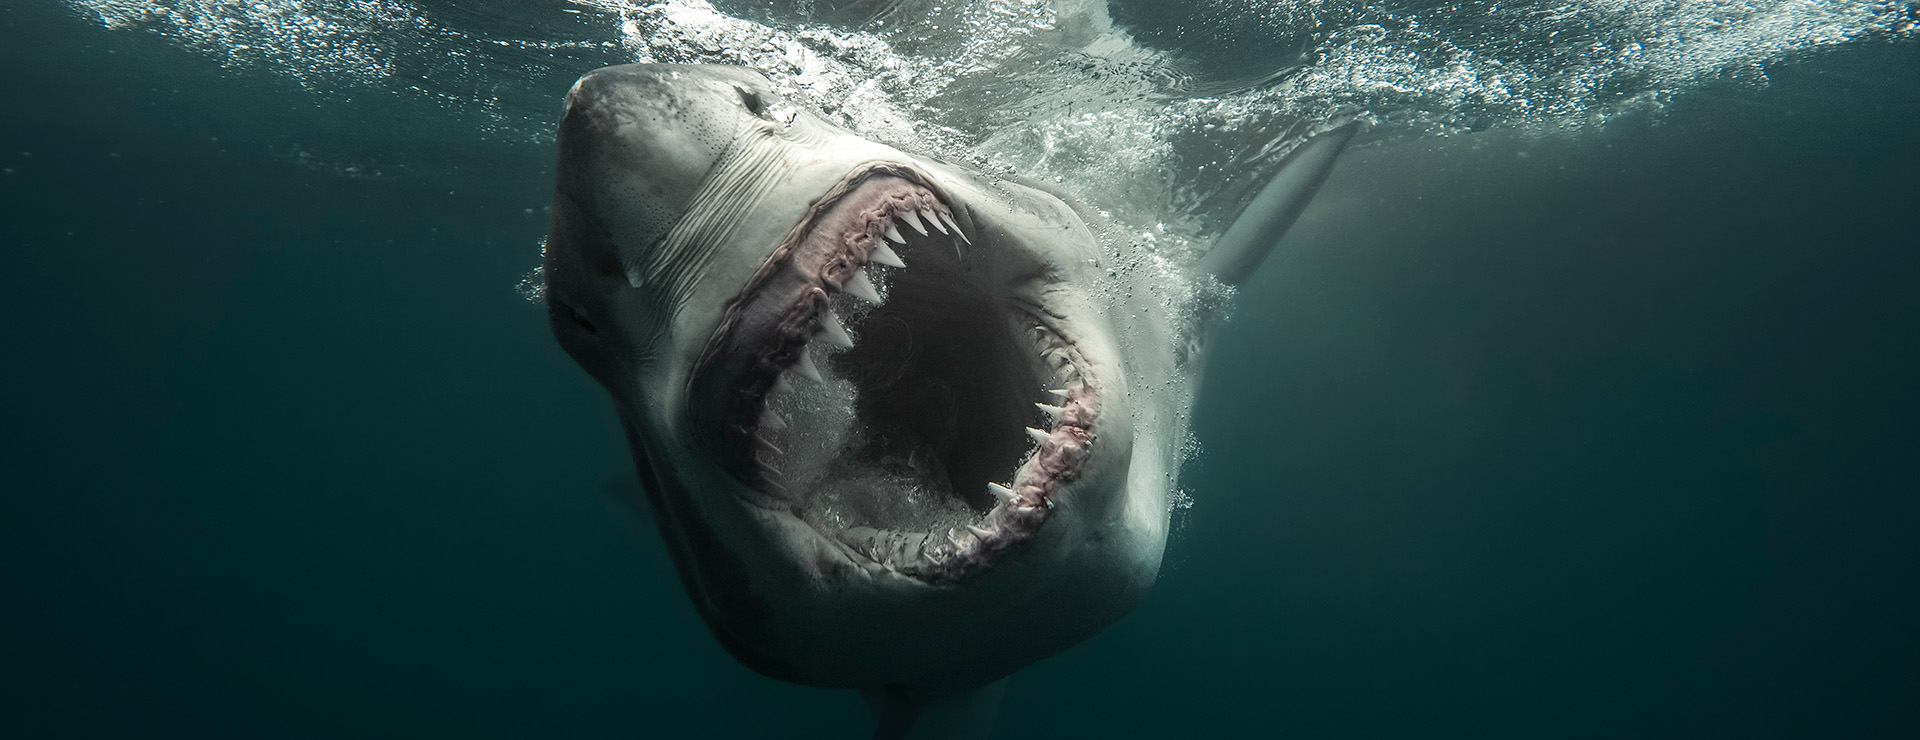
Discovery’s Shark Week (July 26-Aug. 1) tops the Promo Mojo ranker for the week ended July 19, making it TV’s most promoted programming.
Discovery is joined on the list by two fellow cable networks: CNN, which gives some love to its original series Decades in Sports in second place, and Food Network, which whets appetites for barbecue competition Pitmasters in fifth.
Rounding out the top five: CBS, with summer stalwart Big Brother in third place after debuting last week in first, and ABC, with Dancing with the Stars: The Next Pro in fourth.
Notably, Decades in Sports scores the highest iSpot Attention Index (126) in the ranking, meaning viewers were on average highly likely to watch its promos all the way through (vs. interrupting viewing by changing the channel, pulling up the guide, fast-forwarding or turning off the TV).
Spotlight by GEMA partners with iSpot on weekly chart Promo Mojo, offering data revealing the week’s most-promoted programming ranked by TV ad impressions.
For more information about Promo Mojo — including the chart positions of promos beyond the top five — contact mediapartnerships@ispot.tv. Chart positions and other data may be updated in iSpot’s database as additional airings information becomes available.
[Editor’s note: Right click on the videos below to watch in a new browser tab.]
1) Shark Week, Discovery
Impressions: 310,645,686
Interruption Rate: 1.88%
Attention Index: 108 (8% fewer interruptions than avg.)
Imp. Types: National 99%, Local 1%, VOD/OTT 0%
In-network Value: $1,123,675
Out-of-network Est. Spend: $99,446
2) Decades in Sports, CNN
Impressions: 224,957,019
Interruption Rate: 1.11%
Attention Index: 126 (26% fewer interruptions than avg.)
Imp. Types: National 100%, Local 0%, VOD/OTT 0%
In-network Value: $496,943
Out-of-network Est. Spend: $0.00
3) Big Brother, CBS
Impressions: 214,467,284
Interruption Rate: 1.39%
Attention Index: 103 (3% fewer interruptions than avg.)
Imp. Types: National 93%, Local 6%, VOD/OTT 1%
In-network Value: $613,195
Out-of-network Est. Spend: $0.00
4) Dancing with the Stars: The Next Pro, ABC
Impressions: 206,413,117
Interruption Rate: 1.49%
Attention Index: 123 (23% fewer interruptions than avg.)
Imp. Types: National 90%, Local 7%, VOD/OTT 3%
In-network Value: $950,654
Out-of-network Est. Spend: $0.00
5) Pitmasters, Food Network
Impressions: 181,737,793
Interruption Rate: 1.30%
Attention Index: 112 (12% fewer interruptions than avg.)
Imp. Types: National 99%, Local 1%, VOD/OTT 0%
In-network Value: $488,487
Out-of-network Est. Spend: $56,766
Data provided by iSpot.tv, The New Standard for TV Ad Measurement
Impressions - The total impressions within all US households including National Linear (Live & Time-shifted), VOD+OTT, and Local.
Interruption Rate - The percentage of devices that were present at the beginning of your ad but did not complete watching the ad. Actions that interrupt ad play include changing the channel, pulling up the guide, fast-forwarding, or turning off the TV. The Interruption rate is measured on a scale of 0 to 100%.
Attention Index - A comparison of your ad’s Interruption Rate against your specific media placement. The Attention Index is measured on a scale of 0 to 200, where 100 is the average and means your ad is performing as expected.
Imp. Types - Impression types tracked include National (Live + Time-shifted), Local, VOD & OTT. See below for further details.
In-network Value - Estimated media value of in-network promos.
Out-of-network Spend - The estimated amount spent on TV airing time for this promo's spots during a given date range.
National: Live - A national promo which was viewed during live linear television broadcast or same day, via DVR or on-demand.
Local - A promo that was aired during a local ad break slot.
VOD - This includes promos that run in on-demand content past three days (i.e. do not contain the linear promo load)
OTT - On-demand streaming content (i.e. Hulu, Roku, Fire TV Stick, Chromecast).